Airbnb Investment in Paraguay — Market Data 2026
Profitability analysis for Paraguay. Updated occupancy, pricing, and ROI data.
Median Nightly Rate
$66
Occupancy Rate
30%
Active Properties
4,874
Est. Monthly Revenue
$558
median per listing
Market Summary
Short-term rental data in Paraguay
Data as of September 2026
We analyzed 4874 short-term rental properties across Paraguay, spread over 21 cities, with a median rate of $66/night and an occupancy rate of 30%, generating an estimated revenue of $558/month.
Investment Context
Paraguay has emerged as one of South America's most accessible markets for short-term rental investment, with no restrictive regulations and significantly lower operating costs than Argentina or Chile. With 4874 analyzed properties, a median rate of $66/night, and 30% occupancy, estimated monthly revenue is $558. We analyze pricing, occupancy, and estimated revenue data to help investors identify the best opportunities in each city.
Cities to Invest
Sorted by estimated profitability.
Asunción
2,473 listings
Median/Night
$61
Occupancy
50%
Est. Revenue/Mo
$793
San Bernardino
321 listings
Median/Night
$175
Occupancy
13%
Est. Revenue/Mo
$716
Ciudad del Este
300 listings
Median/Night
$60
Occupancy
40%
Est. Revenue/Mo
$681
Fernando de la Mora
123 listings
Median/Night
$41
Occupancy
37%
Est. Revenue/Mo
$544
Encarnación
318 listings
Median/Night
$72
Occupancy
17%
Est. Revenue/Mo
$391
Luque
278 listings
Median/Night
$47
Occupancy
30%
Est. Revenue/Mo
$387
Ypacaraí
101 listings
Median/Night
$138
Occupancy
10%
Est. Revenue/Mo
$337
Itauguá
46 listings
Median/Night
$149
Occupancy
3%
Est. Revenue/Mo
$198
Mariano Roque Alonso
80 listings
Median/Night
$51
Occupancy
10%
Est. Revenue/Mo
$151
San Lorenzo
76 listings
Median/Night
$56
Occupancy
7%
Est. Revenue/Mo
$101
Areguá
80 listings
Median/Night
$141
Occupancy
0%
Est. Revenue/Mo
$0
Caacupé
76 listings
Median/Night
$117
Occupancy
2%
Est. Revenue/Mo
$0
Lambaré
72 listings
Median/Night
$86
Occupancy
3%
Est. Revenue/Mo
$0
Villarrica
42 listings
Median/Night
$80
Occupancy
0%
Est. Revenue/Mo
$0
Ñemby
36 listings
Median/Night
$60
Occupancy
0%
Est. Revenue/Mo
$0
Metropolitan Area — Greater Asunción
19 cities · 4,428 properties
Monthly history in Paraguay
Entire properties, in USD. Median per listing; published months are never restated. · Download CSV
From September 2026, occupied nights are measured day by day and rates come from real 3-night stay quotes. August 2026 uses the previous method (listed rate and forward calendar) and is not compared with the new months.
| Month | $/night | MoM | Occupancy | Chg (pts) | Est. revenue/mo |
|---|---|---|---|---|---|
| August 2026 | $61 | — | 55% | — | $1,170 |
Market Trends (Last 90 Days)
Price and occupancy evolution over time
Data from Sep 17, 2026 to Sep 29, 2026 · Entire homes only, same method as the headline figures.
Price Trend
Median nightly rate
Occupancy Trend
Average occupancy rate
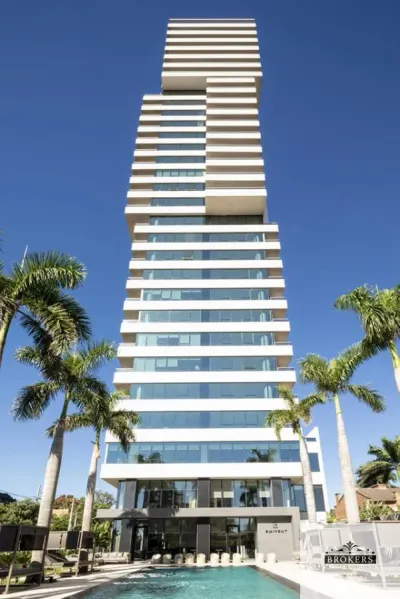
Projects in Paraguay
Real estate projects with available units

















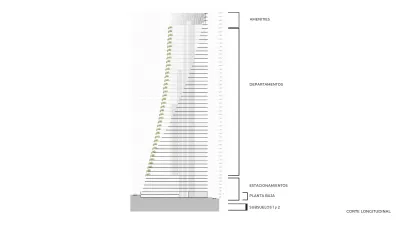
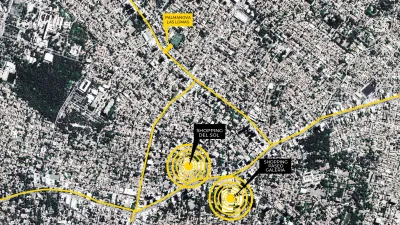
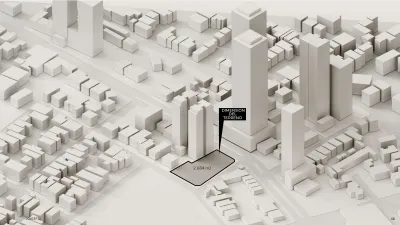
































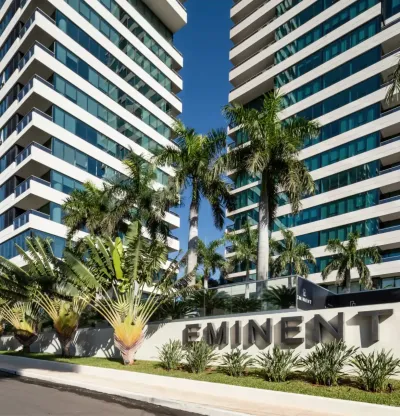




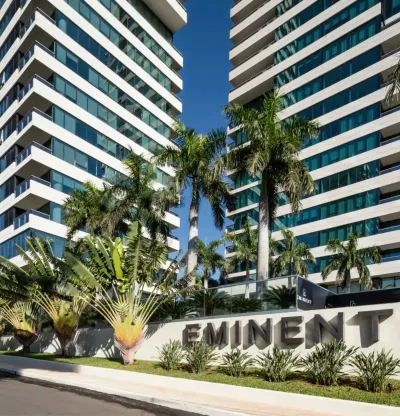



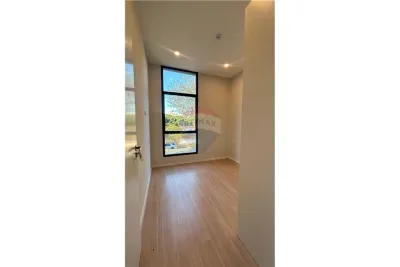
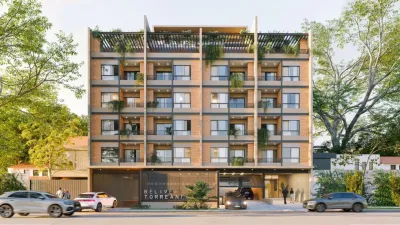
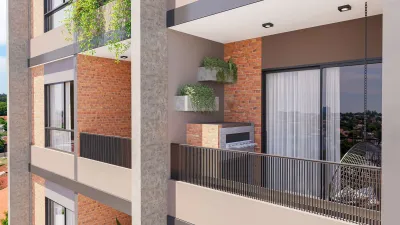
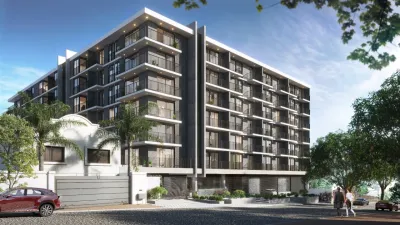
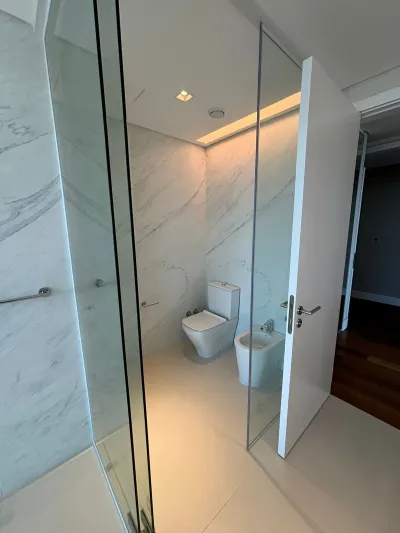
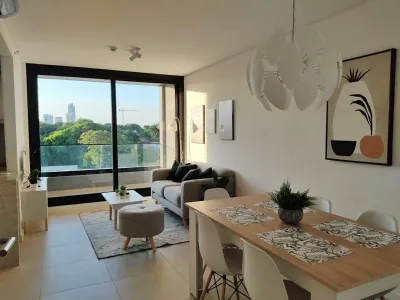
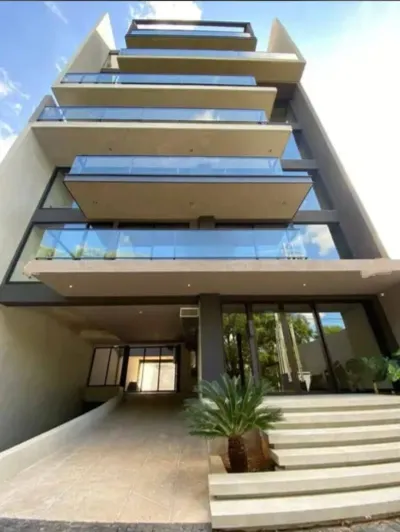
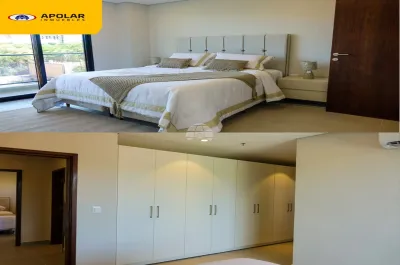
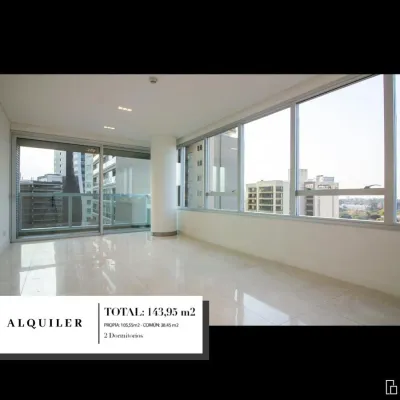
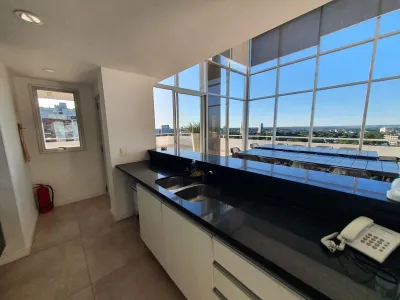
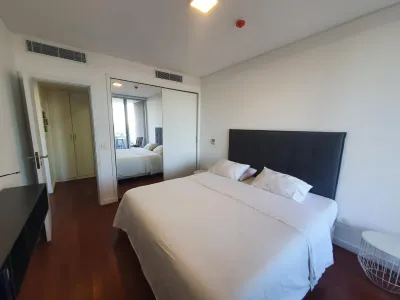
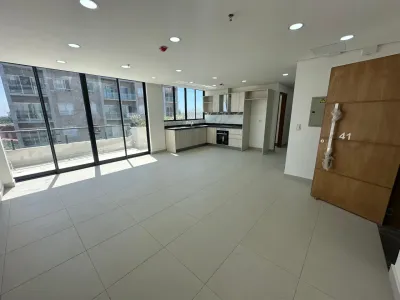
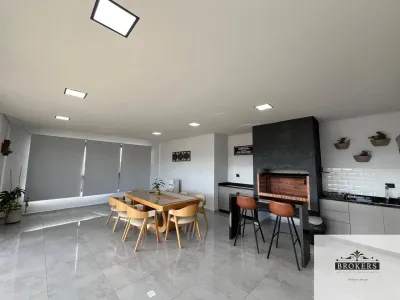
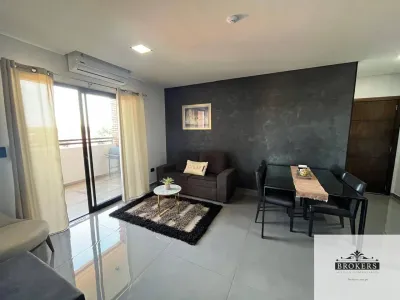
Properties for sale and rent in Paraguay
Explore apartments, houses, and land available in Paraguay.
Properties for Sale in Paraguay
Properties available for purchase
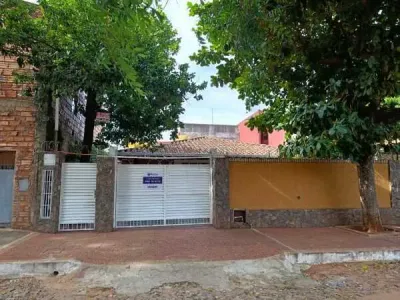
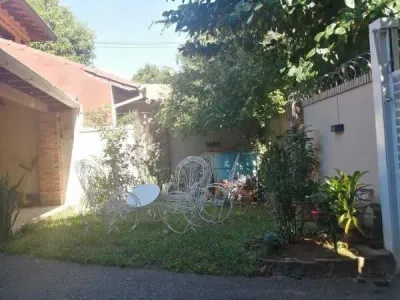











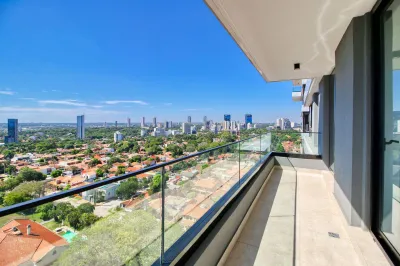

Properties for Rent in Paraguay
Properties available for rent









Short-Term Rental Regulations
▼
Paraguay does not have specific national short-term rental regulations as of 2026. Property rental income is taxed under the standard income tax regime (IRP/IRE). The Municipality of Asunción has discussed implementing a tourist accommodation registry, but it has not been formalized yet. We recommend consulting a local accountant before investing.
Frequently Asked Questions About Investing in Paraguay
The best cities for Airbnb investment in Paraguay are: Asunción, San Bernardino, Encarnación, Ciudad del Este, Luque. These cities have the highest short-term rental demand and offer the best return on investment opportunities.
Ready to Invest in Paraguay?
Properties in Paraguay generate a median of $558/month in short-term rentals.
Methodology
The data in this analysis comes from public Airbnb listings in Paraguay. Prices are calculated from published rates, occupancy is estimated through calendar availability analysis, and revenue is projected using the formula: median rate x occupancy x 30 days. Data is updated daily and represents a sample of 4874 active properties across 21 cities. This page reflects data as of September 2026. Airbnb is a registered trademark of Airbnb, Inc. TuLugar is not affiliated with or endorsed by Airbnb.