Short-Term Rental Investment — Data & ROI in South America 2026
Profitability analysis across 6 countries and 254 cities. Updated occupancy, pricing, and ROI data.
42,006 active properties
6 countries · 254 cities
Argentina
Buenos Aires · Mendoza
10,075 properties · 35 cities
Brazil
12,774 properties · 15 cities
Uruguay
Montevideo · Punta del Este
3,134 properties · 5 cities
Market Summary
Short-term rental data across South America
We analyzed 42006 short-term rental properties across 6 countries and 254 cities in South America, with a median rate of $69/night and an occupancy rate of 53%, generating an estimated revenue of $1,051/month.
Countries to Invest
Sorted by estimated profitability.
Brazil
15 cities · 12,774 listings
Median/Night
$69
Occupancy
57%
Est. Revenue/Mo
$1,171
Argentina(Buenos Aires)
35 cities · 10,075 listings
Median/Night
$68
Occupancy
63%
Est. Revenue/Mo
$1,227
Colombia
104 cities · 6,563 listings
Median/Night
$74
Occupancy
47%
Est. Revenue/Mo
$1,000
Chile
27 cities · 4,586 listings
Median/Night
$59
Occupancy
47%
Est. Revenue/Mo
$855
Paraguay
68 cities · 4,874 listings
Median/Night
$66
Occupancy
30%
Est. Revenue/Mo
$558
Uruguay
5 cities · 3,134 listings
Median/Night
$104
Occupancy
33%
Est. Revenue/Mo
$1,032
Best Cities for Short-Term Rentals
Cities with the most properties in South America
Buenos Aires
Argentina
São Paulo
Brazil
Rio de Janeiro
Brazil
Medellín
Colombia
Santiago
Chile
Asunción
Paraguay
Punta del Este
Uruguay
Montevideo
Uruguay
Bogotá
Colombia
Florianópolis
Brazil
Cartagena
Colombia
Salvador
Brazil
Buenos Aires vs Asunción — Comparison
Comparison of the two largest cities
| Metric | Buenos Aires | Asunción |
|---|---|---|
| Listings | 8,010 | 2,473 |
| Median Price/Night | $68 | $61 |
| Occupancy | 67% | 50% |
| Est. Revenue/Mo | $1,280 | $793 |
Buenos Aires
Asunción
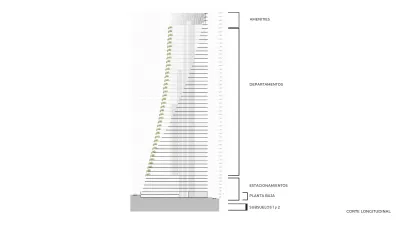
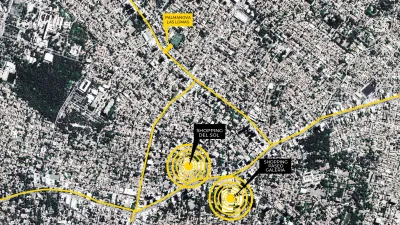
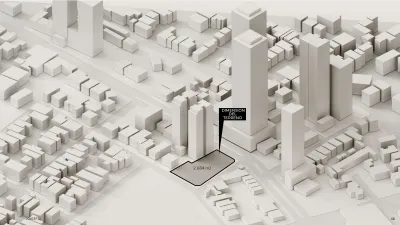
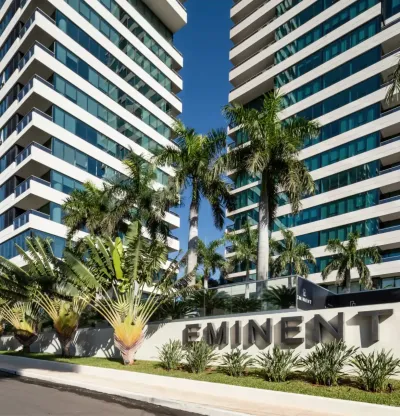
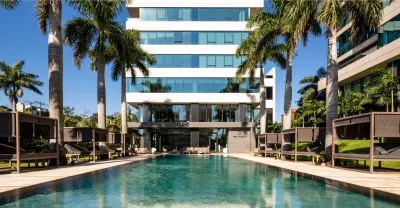
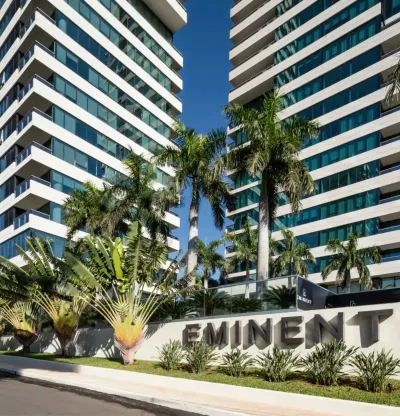
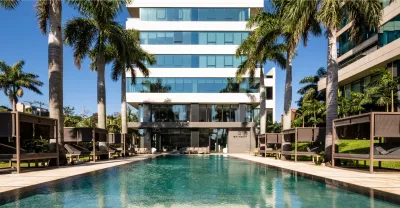
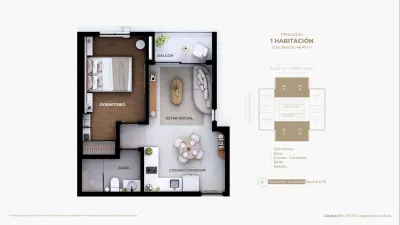
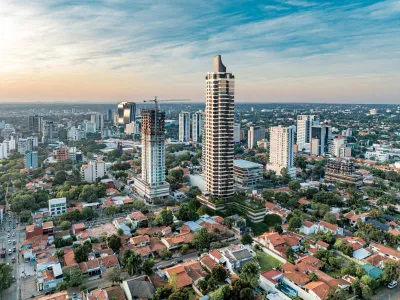
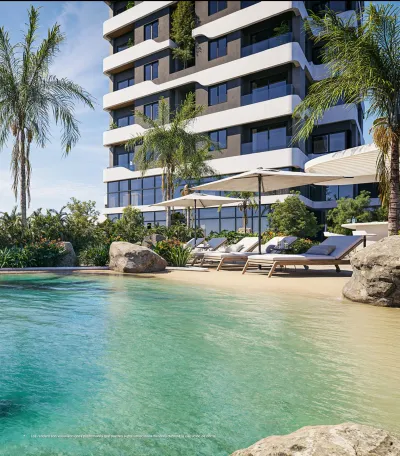
Real Estate Projects in Paraguay
Projects with available units for investment in Paraguay
















































































Properties for Sale in Brazil
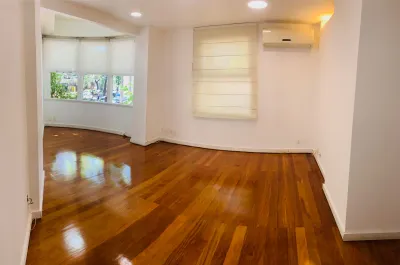
Properties available for purchase in Brazil

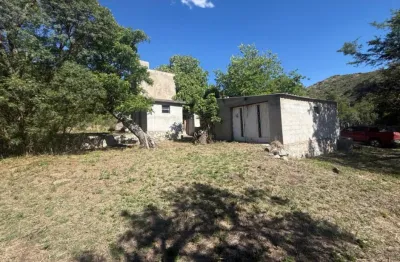
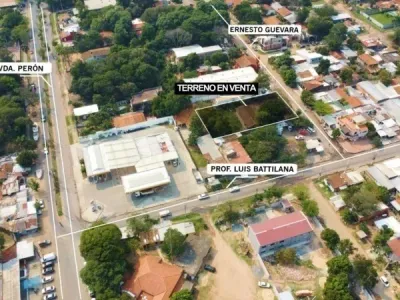
Properties for Sale in Argentina
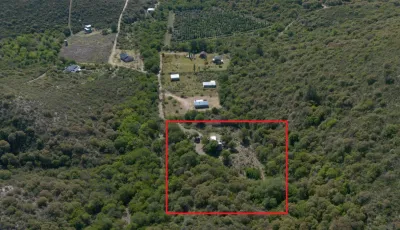
Properties available for purchase in Argentina
Properties for Sale in Colombia
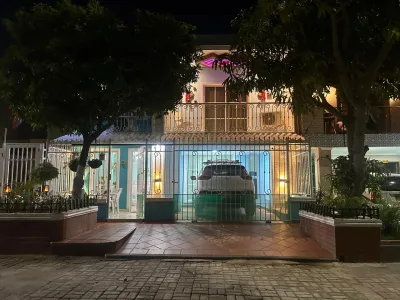
Properties available for purchase in Colombia
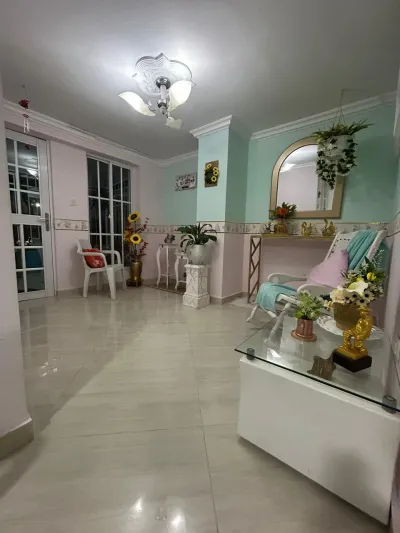
Properties for Sale in Paraguay
Properties available for purchase in Paraguay
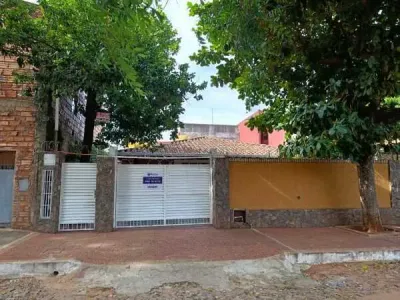
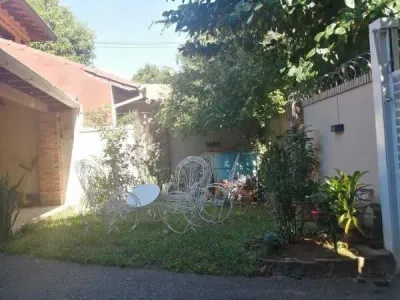











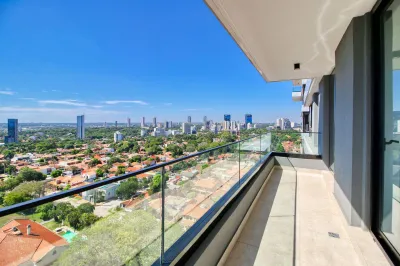

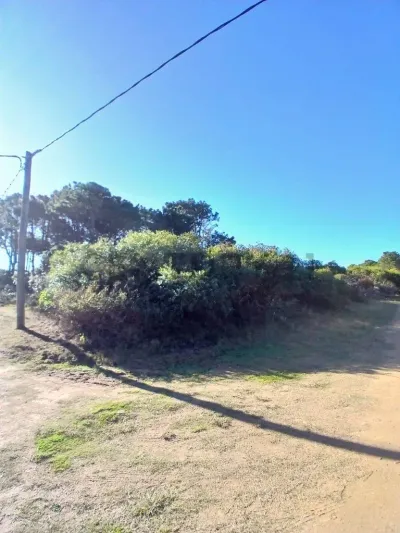
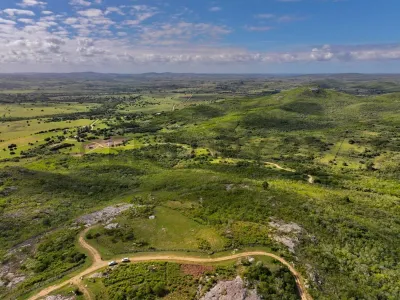
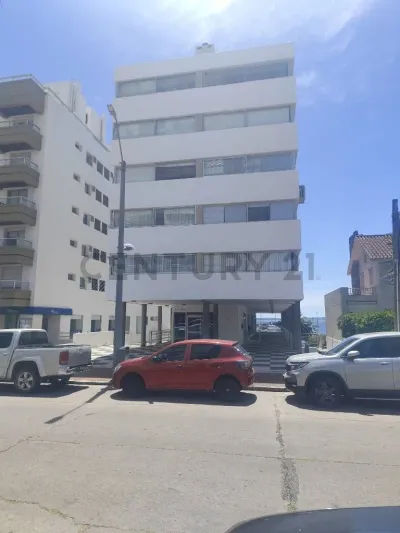
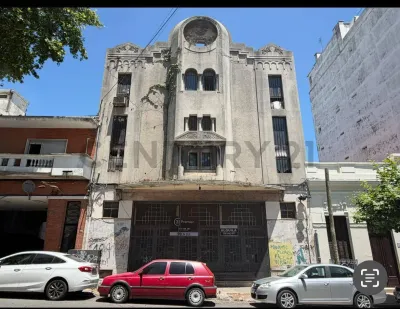
Properties for Sale in Uruguay
Properties available for purchase in Uruguay










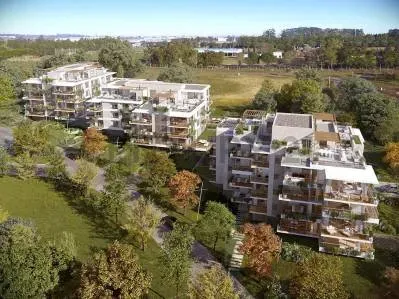


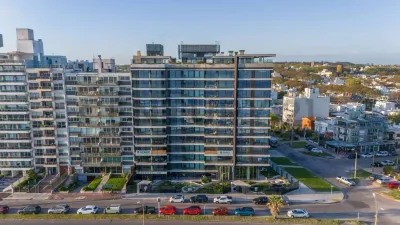
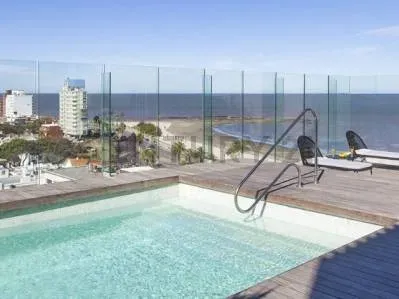


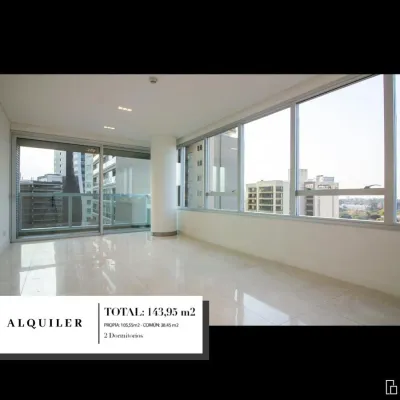
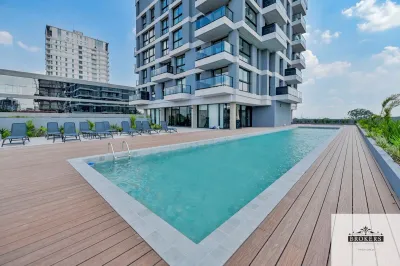
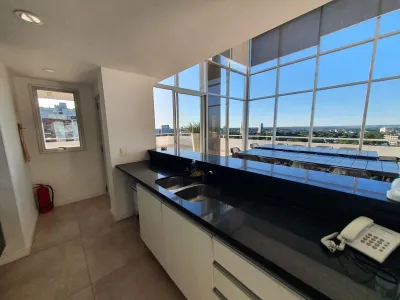
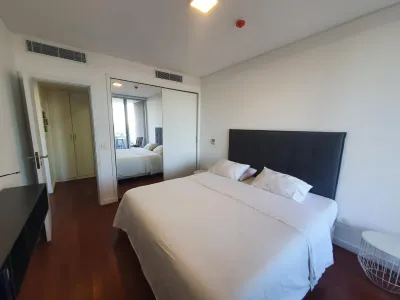
Properties for Rent in Paraguay
Properties available for rent in Paraguay
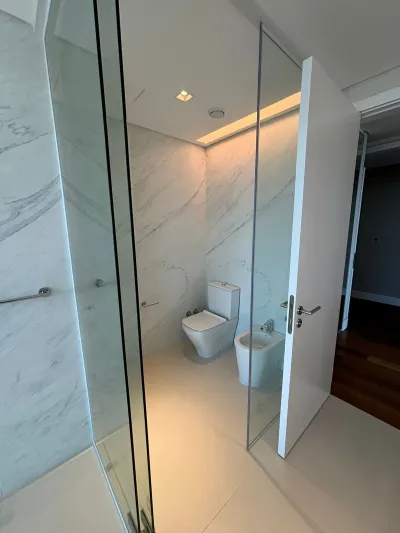






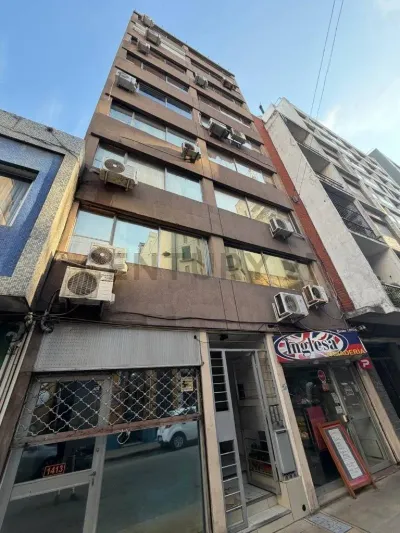
Properties for Rent in Uruguay
Properties available for rent in Uruguay






Frequently Asked Questions About Investing in South America
The most attractive markets for Airbnb investment in the region are: Brazil, Argentina, Colombia, Paraguay, Chile. Paraguay stands out for having no restrictive regulations and low operating costs, while Argentina offers the largest market with high tourist demand. The median nightly rate across the region is $69. We analyze 42,006 properties across 254 cities to help you compare.
Short-Term Rental Investment Guide
South America is one of the world's most dynamic regions for short-term rental investment. With 42,006 active properties across 254 cities, the region offers opportunities for investors of all profiles — from apartments in capital cities to properties in emerging tourist destinations.
Brazil
Brazil has 12,774 short-term rental properties across 15 cities. The median rate is $69/night with 57% occupancy, generating estimated revenue of $1171/month.
Top cities: São Paulo (6305), Rio de Janeiro (3652), Florianópolis (910), Salvador (768), Armação dos Búzios (656)
Argentina
Argentina has 10,075 short-term rental properties across 35 cities. The median rate is $68/night with 63% occupancy, generating estimated revenue of $1227/month.
Top cities: Buenos Aires (8010), Córdoba (580), San Carlos de Bariloche (373), Mendoza (348), Luján de Cuyo (143)
Colombia
Colombia has 6,563 short-term rental properties across 104 cities. The median rate is $74/night with 47% occupancy, generating estimated revenue of $1000/month.
Top cities: Medellín (2954), Bogotá (938), Cartagena (840), Rionegro (70), Bello (41)
Paraguay
Paraguay has 4,874 short-term rental properties across 68 cities. The median rate is $66/night with 30% occupancy, generating estimated revenue of $558/month.
Top cities: Asunción (2473), San Bernardino (321), Encarnación (318), Ciudad del Este (300), Luque (278)
Chile
Chile has 4,586 short-term rental properties across 27 cities. The median rate is $59/night with 47% occupancy, generating estimated revenue of $855/month.
Top cities: Santiago (2687), Valparaíso (468), Ñuñoa (457), Viña del Mar (298), Providencia (183)
Uruguay
Uruguay has 3,134 short-term rental properties across 5 cities. The median rate is $104/night with 33% occupancy, generating estimated revenue of $1032/month.
Top cities: Punta del Este (1502), Montevideo (1502), Maldonado (111), Ciudad de la Costa (18), Paso Carrasco (1)
How to Start Investing
- Research the market: Compare cities and their profitability metrics on this page.
- Define your budget: Explore properties for sale and available real estate projects.
- Contact professionals: Connect with local agencies and developers for guidance.
- Analyze profitability: Use our occupancy and revenue data to project your return on investment.
All Cities with Short-Term Rental Data
Explore the market in every city across South America
Brazil
9 cities · 12,877 listings
Argentina
12 cities · 9,734 listings
Colombia
15 cities · 5,057 listings
Paraguay
30 cities · 4,757 listings
Chile
19 cities · 4,568 listings
Uruguay
4 cities · 3,133 listings
Methodology
The data comes from public Airbnb listings. The nightly rate is the median of real 3-night stay quotes (in USD) for dates in the last 30 days. Occupancy is the median share of nights blocked over those 30 days, read from the calendar before each date, among entire homes that take short stays. The revenue of each property is its rate × occupancy × 30 days, and the median is shown. Each figure uses only properties with enough data (minimum 5) and is updated daily, across 42006 active properties in 6 countries and 254 cities. Airbnb is a registered trademark of Airbnb, Inc. TuLugar is not affiliated with or endorsed by Airbnb.