Airbnb in Pinares, Punta del Este — Profitability & ROI 2026
Short-term rental data and profitability in Pinares, Punta del Este, Uruguay. Analyze occupancy, prices, and ROI.
Nightly Rate
$138
Occupancy
19%
Active Properties
1,230
Monthly Income
$1,196
median per listing

Market Summary
Pinares vs Punta del Este average
Data as of November 2026
We analyzed 1230 short-term rental properties in Pinares, with a median rate of $138/night and an occupancy rate of 19%, generating an estimated revenue of $1196/month. On TuLugar we have 7 properties available in this neighborhood.
| Metric | Neighborhood Pinares | City Punta del Este | Difference |
|---|---|---|---|
| Median Nightly Rate | $138 | $139 | -1% |
| Occupancy Rate | 19% | 17% | +2pp |
| Active Properties | 1230 | 2720 | 45% |
| Est. Monthly Revenue | $1,196 | $1,095 | +9% |
Profitability by Bedrooms
How price and occupancy vary by number of bedrooms.
| bedrooms | Analyzed Properties | Nightly Rate | Occupancy | Avg. Monthly Income |
|---|---|---|---|---|
| SStudio | 397 | $103 | 0% | $929 |
| 11 bedroom | 383 | $115 | 30% | $1,107 |
| 22 bedrooms | 300 | $156 | 17% | $1,268 |
| 33 bedrooms | 99 | $223 | 23% | $1,782 |
| 44 bedrooms | 38 | $371 | 17% | $2,922 |
| 5+5+ bedrooms | 13 | - | 63% | - |
Market Trends (Last 90 Days)
Price and occupancy evolution over time
Over the last 59 days, the median price in Pinares increased 13.2% to $136/night. Occupancy dropped to 22%.
Analyzed properties in Pinares
1230 properties with short-term rental data
| # | Property | Price/Night (30d) |
|---|---|---|
| 1 | Apartment · 5 bedrooms | $974 |
| 2 | Apartment · 5 bedrooms | $1196 |
| 3 | Apartment · 2 bedrooms | $657 |
| 4 | Apartment · 7 bedrooms | $448 |
| 5 | Apartment · 4 bedrooms | $832 |
| 6 | Apartment · 3 bedrooms | $604 |
| 7 | Apartment · 2 bedrooms | $351 |
| 8 | Apartment · 1 bedroom | $243 |
| 9 | Apartment · 4 bedrooms | $455 |
| 10 | Apartment · 4 bedrooms | $226 |
Showing 1-10 of 1230 properties
What does short-term renting yield here?
What a typical Airbnb billed over the last 30 days, annualized, against what a typical apartment costs to buy in the same neighborhood. It does not yet reflect seasonality.
Gross annual yield
4.2%
Gross: before cleaning, platform fees, management, furnishing and tax. It is the ceiling, not the take-home.
- Median revenue, last 30 days × 12 (Airbnb)
- $14,352/yr
- 375 Airbnb
- Median apartment price
- $340,000
- 5098 en venta
Compares the typical Airbnb with the typical apartment for sale. Where those are not the same kind of home, the ratio drifts.
Airbnb as of November 15 · sale prices as of November 15. The two sources refresh separately.
See this neighborhood’s sale market →Properties for sale and rent in Pinares
Explore apartments, houses, and land available in Pinares.
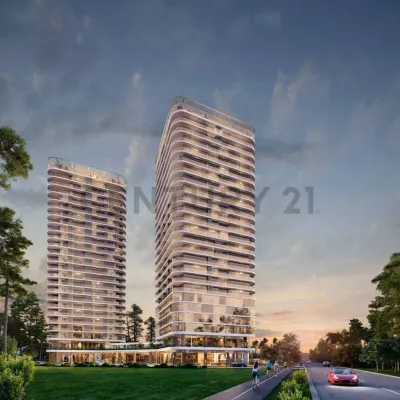
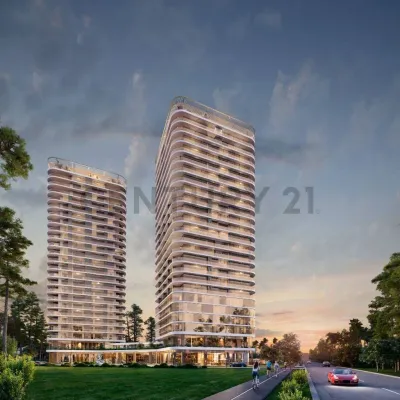
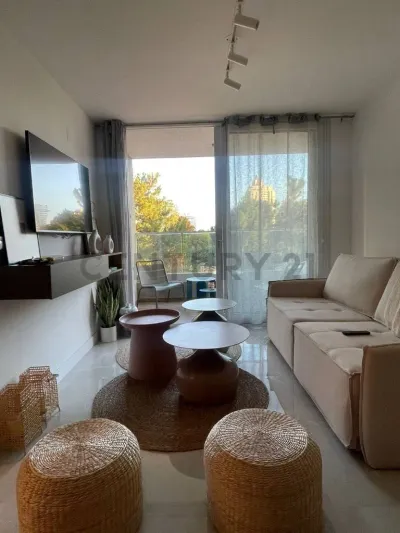
Properties for Sale in Pinares
Properties available for purchase in this neighborhood









Ready to Invest in Pinares?
Properties in Pinares generate a median of $1,196/month in short-term rentals.
Frequently Asked Questions About Investing in Pinares
Pinares has a median rate of $138/night with 19% occupancy and 1,230 active properties. Compared to Punta del Este, the nightly rate is similar to the city average and occupancy is 11% above the city average.
Methodology
The data in this analysis comes from public Airbnb listings in Pinares, Punta del Este. Prices are calculated from published rates, occupancy is estimated through calendar availability analysis, and revenue is projected using the formula: median rate x occupancy x 30 days. Data is updated daily and represents a sample of 1230 active properties. This page reflects data as of November 2026. Airbnb is a registered trademark of Airbnb, Inc. TuLugar is not affiliated with or endorsed by Airbnb.