
Airbnb Investment in Punta del Este: Profitability & ROI 2026
Short-term rental data and profitability in Punta del Este, Uruguay. Analyze occupancy, prices, and ROI by neighborhood.
Median/Night
$139
Occupancy
20%
Active Properties
2,774
Monthly Income
$858
median per listing

Market Summary
Short-term rental data in Punta del Este
Data as of October 2026
We analyzed 2772 short-term rental properties in Punta del Este, with a median rate of $139/night and an occupancy rate of 20%, generating an estimated revenue of $858/month. On TuLugar we have 17 properties available in this city.
Profitability by Bedrooms
How price and occupancy vary by number of bedrooms.
| bedrooms | Listings | Nightly Rate | Occupancy | Est. Monthly Income |
|---|---|---|---|---|
| SStudio | 1,099 | $87 | 20% | $701 |
| 11 bedroom | 727 | $111 | 23% | $775 |
| 22 bedrooms | 538 | $158 | 20% | $936 |
| 33 bedrooms | 268 | $261 | 18% | $1,530 |
| 44 bedrooms | 105 | $400 | 10% | $839 |
| 5+5+ bedrooms | 35 | $540 | 13% | $3,152 |
Investment Context
Looking to invest in Airbnb in Punta del Este? With 2772 analyzed properties, a median rate of $139/night, and 20% occupancy, investors can expect an estimated monthly revenue of $858. The city has 5 neighborhoods with profitability data, with Pinares standing out as one of the most attractive for investment. Use this data to compare areas, evaluate returns, and make informed decisions before investing in a short-term rental property.
Monthly history in Punta del Este
Entire properties, in USD. Median per listing; published months are never restated. · Download CSV
From September 2026, occupied nights are measured day by day and rates come from real 3-night stay quotes. August 2026 uses the previous method (listed rate and forward calendar) and is not compared with the new months.
| Month | $/night | MoM | Occupancy | Chg (pts) | Est. revenue/mo |
|---|---|---|---|---|---|
| September 2026 | $138 | — | 17% | — | $756 |
| Previous method (through August 2026): listed rate and forward calendar — not comparable with the months above. | |||||
| August 2026 | $130 | — | 52% | — | $2,280 |
Best Neighborhoods to Invest
Profitability comparison by area. Price, occupancy, and estimated income data.
| # | Neighborhood | Properties Analyzed | Nightly Rate | Occupancy | Avg. Monthly Income | Gross yield |
|---|---|---|---|---|---|---|
| 1 | La Barra | 135 | $323 | 15% | $1,306 | 2.6% |
| 2 | El Tesoro | 36 | $116 | 43% | $1,103 | 4.1% |
| 3 | Pinares | 1,246 | $137 | 23% | $1,017 | - |
| 4 | Península | 739 | $125 | 20% | $861 | - |
| 5 | Playa Brava | 21 | $127 | 13% | $796 | 2.1% |
Market Trends (Last 90 Days)
Price and occupancy evolution over time
Over the last 36 days, the median price in Punta del Este increased 19.6% to $138/night. Occupancy dropped to 19%.
Nearby Cities
Other cities with short-term rental data near Punta del Este
Properties for sale and rent in Punta del Este
Explore apartments, houses, and land available in Punta del Este.
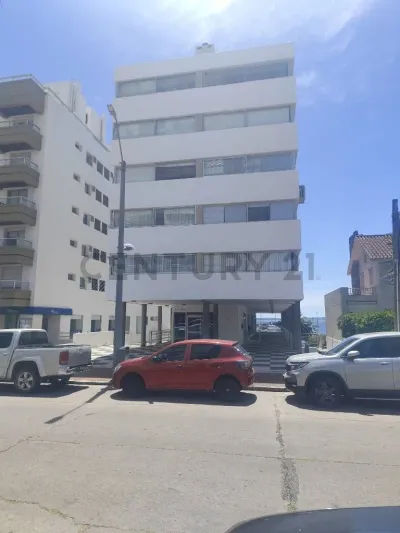
Properties for Sale in Punta del Este
Properties available for purchase in this city












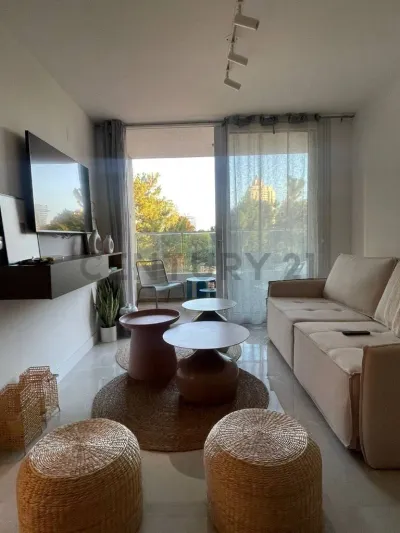







Properties for Rent in Punta del Este
Properties available for rent in this city

Ready to Invest in Punta del Este?
Properties in Punta del Este generate a median of $858/month in short-term rentals.
Methodology
The data in this analysis comes from public Airbnb listings in Punta del Este. Prices are calculated from published rates, occupancy is estimated through calendar availability analysis, and revenue is projected using the formula: median rate x occupancy x 30 days. Data is updated daily and represents a sample of 2772 active properties. This page reflects data as of October 2026. Airbnb is a registered trademark of Airbnb, Inc. TuLugar is not affiliated with or endorsed by Airbnb.