
Airbnb Investment in Brazil — Market Data 2026
Profitability analysis for Brazil. Updated occupancy, pricing, and ROI data.
Median Nightly Rate
$77
Occupancy Rate
57%
Active Properties
29,752
Est. Monthly Revenue
$1,344
median per listing
Market Summary
Short-term rental data in Brazil
Data as of November 2026
We analyzed 29752 short-term rental properties across Brazil, spread over 11 cities, with a median rate of $77/night and an occupancy rate of 57%, generating an estimated revenue of $1,344/month.
Investment Context
The short-term rental market in Brazil presents attractive investment opportunities. With 29752 analyzed properties, a median rate of $77/night, and 57% occupancy, estimated monthly revenue is $1,344. We analyze pricing, occupancy, and estimated revenue data to help investors identify the best opportunities in each city.
Cities to Invest
Sorted by estimated profitability.
Arraial do Cabo
62 listings
Median/Night
$124
Occupancy
60%
Est. Revenue/Mo
$2,179
Armação dos Búzios
1,264 listings
Median/Night
$125
Occupancy
26%
Est. Revenue/Mo
$1,555
São Paulo
13,075 listings
Median/Night
$76
Occupancy
63%
Est. Revenue/Mo
$1,433
Florianópolis
2,362 listings
Median/Night
$83
Occupancy
44%
Est. Revenue/Mo
$1,344
Niterói
45 listings
Median/Night
$77
Occupancy
65%
Est. Revenue/Mo
$1,340
Rio de Janeiro
10,379 listings
Median/Night
$80
Occupancy
50%
Est. Revenue/Mo
$1,232
Foz do Iguaçu
353 listings
Median/Night
$65
Occupancy
63%
Est. Revenue/Mo
$1,201
Cabo Frio
156 listings
Median/Night
$81
Occupancy
44%
Est. Revenue/Mo
$1,054
Salvador
1,927 listings
Median/Night
$62
Occupancy
42%
Est. Revenue/Mo
$921
São Pedro da Aldeia
68 listings
Median/Night
$72
Occupancy
33%
Est. Revenue/Mo
$426
Monthly history in Brazil
Entire properties, in USD. Median per listing; published months are never restated. · Download CSV
From September 2026, occupied nights are measured day by day and rates come from real 3-night stay quotes. August 2026 uses the previous method (listed rate and forward calendar) and is not compared with the new months.
| Month | $/night | MoM | Occupancy | Chg (pts) | Est. revenue/mo |
|---|---|---|---|---|---|
| October 2026 | $75 | +9.2% | 58% | +1.4 pts | $1,308 |
| September 2026 | $69 | — | 57% | — | $1,168 |
| Previous method (through August 2026): listed rate and forward calendar — not comparable with the months above. | |||||
| August 2026 | $57 | — | 70% | — | $1,197 |
Market Trends (Last 90 Days)
Price and occupancy evolution over time
Data from Sep 17, 2026 to Nov 14, 2026 · Entire homes only, same method as the headline figures.
Price Trend
Median nightly rate
Occupancy Trend
Average occupancy rate
Over the last 59 days, the median price in Brazil increased 17.8% to $70/night. Occupancy dropped to 56%.
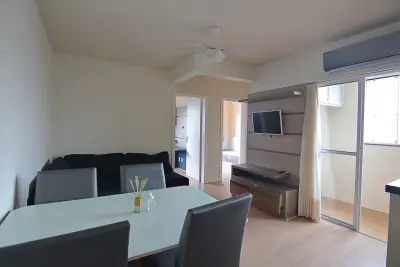
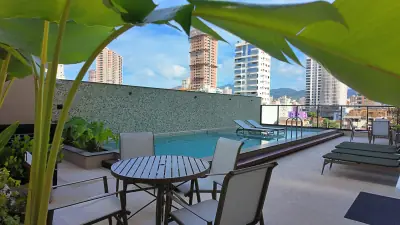
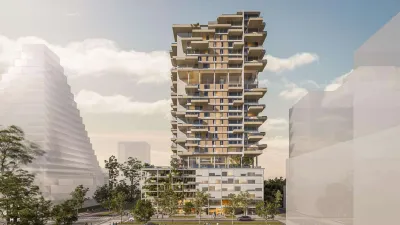
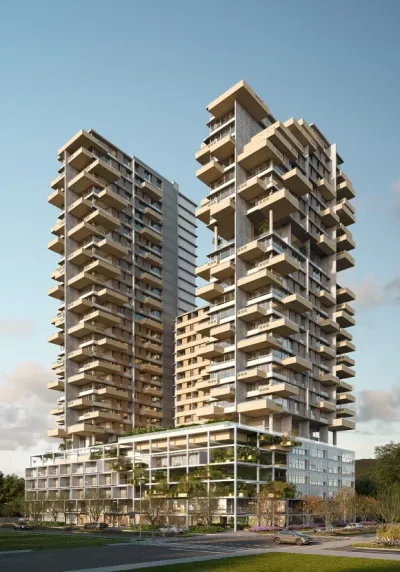
Properties for sale and rent in Brazil
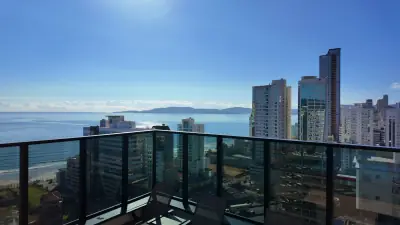
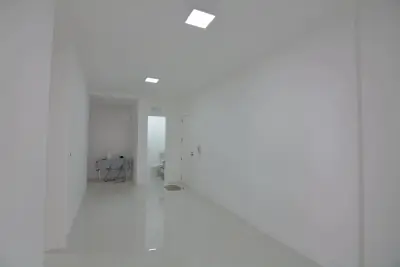
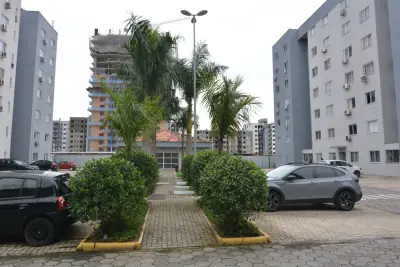
Explore apartments, houses, and land available in Brazil.
Properties for Sale in Brazil
Properties available for purchase






Frequently Asked Questions About Investing in Brazil
The best cities for Airbnb investment in Brazil are: São Paulo, Rio de Janeiro, Florianópolis, Salvador, Armação dos Búzios. These cities have the highest short-term rental demand and offer the best return on investment opportunities.
Ready to Invest in Brazil?
Properties in Brazil generate a median of $1,344/month in short-term rentals.
Methodology
The data in this analysis comes from public Airbnb listings in Brazil. Prices are calculated from published rates, occupancy is estimated through calendar availability analysis, and revenue is projected using the formula: median rate x occupancy x 30 days. Data is updated daily and represents a sample of 29752 active properties across 11 cities. This page reflects data as of November 2026. Airbnb is a registered trademark of Airbnb, Inc. TuLugar is not affiliated with or endorsed by Airbnb.